Mitigating Disparities
This demo shows how to run the mitigate_disparity scripot on a development dataset. Below, we demonstrate how to run mitgate_disparity.py from the command line using a model trained to predict risk of admission to the emergency department using the freely available MIMIC-IV repository.
Inputs
In addition to providing a dataset, the user should identify protected features by providing a list of column names corresponding to demographics and/or other variables over which fairness should be sought.
Continuous Updating
This script may also be used to update a model with new data by passing a starting_point parameter. This allows models to be continously updated over time as new biases arise and dataset shift occurs, without having to start from scratch. Under the hood, this is done by setting checkpoint=True in the FomoClassifier object. See the Fomo docs for more information on options.
You may also browse the API for mitigate_disparity.py.
Below, we run mitigate_disparity.py using a development dataset and specifying that we want to ensure fairness with respect to the features named ethnicity, gender, and insurance.
[ ]:
%run ../mitigate_disparity.py \
    --dataset ../data/mimic/development_dataset.train.csv \
    --protected_features ethnicity,gender,insurance
Calling mitigate_disparity.py will produce an estimator.pkl file that can be loaded for further analysis. We demonstrate this below.
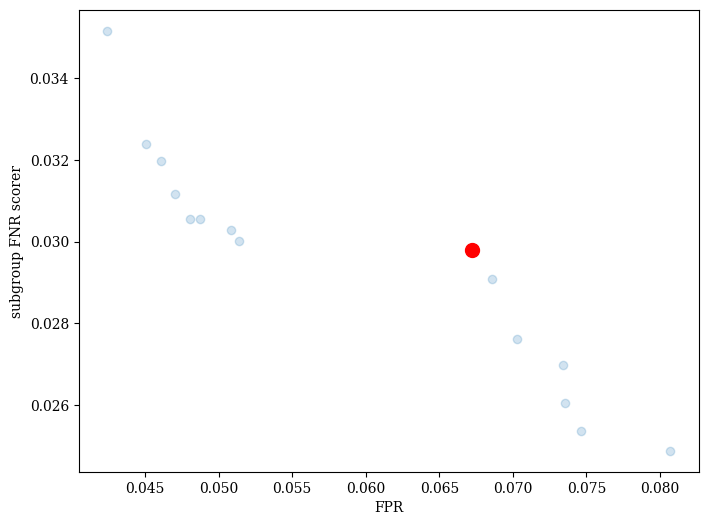
Visualize fairness/error trade-offs
Once training is done, we can view a set of candidate models. The red dot indicates the model that was selected. In addition to the default “PseudoWeights” approach, FOMO provides other multi-criteria decsion making (MCDM) algorithms via pymoo.
[1]:
import pickle
with open('../estimator.pkl','rb') as f:
    est = pickle.load(f)
est.plot().show()
[1]:
<pymoo.visualization.scatter.Scatter at 0x7f351266cb50>
check test set performance
This cell generates input for the measure_disparity script.
[2]:
# add path to sys to import functions
import os
import sys
dir_path = os.getcwd()
sys.path.insert(0,os.path.abspath(os.path.join(dir_path, '..')))

from utils import make_measure_dataset
import pandas as pd

import pickle
with open('../estimator.pkl','rb') as f:
    est = pickle.load(f)

df_test = pd.read_csv('../data/mimic/development_dataset.test.csv')
X_test = df_test.drop(columns='binary outcome')
y_test = df_test['binary outcome']
make_measure_dataset(est, 'fomo', X_test, y_test)
insurance
['Medicaid', 'Medicare', 'Other']
[2 0 1]
ethnicity
['AMERICAN INDIAN/ALASKA NATIVE', 'ASIAN', 'BLACK/AFRICAN AMERICAN', 'HISPANIC/LATINO', 'WHITE']
[4 3 2 0 1]
gender
['F', 'M']
[1 0]
measure change in disparity measures
Now that we have an updated model, we can check how our disparity measures have changed. Below we run measure_disparity.py with our new results and compare the results to the old ones.
[3]:
from measure_disparity import measure_disparity
measure_disparity('../fomo_model_mimic4_admission.csv', save_file='df_fairness.post.csv')
reading in ../fomo_model_mimic4_admission.csv
demographic columns: ['insurance', 'ethnicity', 'gender']
========================================
Overall Performance
========================================
        Measures of predictive bias on the whole population.
╭─────────┬─────────┬───────────────────┬───────┬───────┬────────────╮
│   AUROC │   AUPRC │   Positivity Rate │   FPR │   FNR │   Accuracy │
├─────────┼─────────┼───────────────────┼───────┼───────┼────────────┤
│   0.859 │    0.74 │             0.297 │ 0.053 │ 0.537 │      0.804 │
╰─────────┴─────────┴───────────────────┴───────┴───────┴────────────╯
========================================
Subgroup Fairness Violations
========================================
        Measures the deviation in performance for marginal and intersectional groups.
        Note that these deviation are weighted by group prevalence to produce stable estimates when sample sizes are small.
╭─────────────┬───────────────────────────────┬──────────┬─────────────────────┬─────────┬─────────┬───────────────────╮
│   insurance │                     ethnicity │   gender │   Brier Score (MSE) │     FNR │     FPR │   Positivity Rate │
├─────────────┼───────────────────────────────┼──────────┼─────────────────────┼─────────┼─────────┼───────────────────┤
│         any │                           any │        F │              -0.006 │   0.003 │  -0.004 │            -0.011 │
│         any │                           any │        M │               0.006 │  -0.005 │   0.006 │             0.011 │
│         any │ AMERICAN INDIAN/ALASKA NATIVE │      any │                 0.0 │   0.014 │  -0.007 │              -0.0 │
│         any │                         ASIAN │      any │               0.001 │   0.017 │   0.006 │               0.0 │
│         any │        BLACK/AFRICAN AMERICAN │      any │              -0.013 │   0.011 │  -0.033 │          **-0.022 │
│         any │               HISPANIC/LATINO │      any │              -0.005 │    0.01 │  -0.035 │            -0.009 │
│         any │                         WHITE │      any │             **0.016 │  -0.008 │    0.02 │             0.031 │
│    Medicaid │                           any │      any │              -0.006 │   0.006 │   -0.03 │            -0.009 │
│    Medicaid │ AMERICAN INDIAN/ALASKA NATIVE │        F │                -0.0 │   0.009 │  -0.069 │              -0.0 │
│    Medicaid │ AMERICAN INDIAN/ALASKA NATIVE │        M │                -0.0 │    -0.0 │  -0.019 │              -0.0 │
│    Medicaid │                         ASIAN │        F │                -0.0 │   0.015 │  -0.001 │              -0.0 │
│    Medicaid │                         ASIAN │        M │                 0.0 │    0.01 │   0.012 │               0.0 │
│    Medicaid │        BLACK/AFRICAN AMERICAN │        F │              -0.002 │   0.008 │  -0.047 │            -0.003 │
│    Medicaid │        BLACK/AFRICAN AMERICAN │        M │              -0.001 │   0.005 │   -0.05 │            -0.002 │
│    Medicaid │               HISPANIC/LATINO │        F │              -0.001 │   0.011 │   -0.05 │            -0.002 │
│    Medicaid │               HISPANIC/LATINO │        M │                -0.0 │   0.021 │  -0.028 │            -0.001 │
│    Medicaid │                         WHITE │        F │                -0.0 │   0.006 │  -0.003 │              -0.0 │
│    Medicaid │                         WHITE │        M │              -0.001 │  -0.004 │   -0.01 │              -0.0 │
│    Medicare │                           any │      any │               0.006 │  -0.015 │   0.016 │             0.017 │
│    Medicare │ AMERICAN INDIAN/ALASKA NATIVE │        F │                 0.0 │   0.002 │ **0.064 │               0.0 │
│    Medicare │ AMERICAN INDIAN/ALASKA NATIVE │        M │                 0.0 │   0.013 │   0.018 │               0.0 │
│    Medicare │                         ASIAN │        F │                 0.0 │   0.019 │   0.011 │               0.0 │
│    Medicare │                         ASIAN │        M │                 0.0 │   0.013 │   0.015 │               0.0 │
│    Medicare │        BLACK/AFRICAN AMERICAN │        F │              -0.001 │   0.009 │   -0.02 │            -0.002 │
│    Medicare │        BLACK/AFRICAN AMERICAN │        M │              -0.001 │   0.011 │  -0.026 │            -0.001 │
│    Medicare │               HISPANIC/LATINO │        F │              -0.001 │  -0.002 │  -0.029 │            -0.001 │
│    Medicare │               HISPANIC/LATINO │        M │                -0.0 │   0.005 │  -0.023 │              -0.0 │
│    Medicare │                         WHITE │        F │               0.004 │  -0.022 │    0.03 │             0.011 │
│    Medicare │                         WHITE │        M │               0.004 │  -0.025 │   0.029 │             0.011 │
│       Other │                           any │      any │                -0.0 │   0.007 │  -0.002 │            -0.008 │
│       Other │ AMERICAN INDIAN/ALASKA NATIVE │        F │                -0.0 │   0.012 │  -0.017 │              -0.0 │
│       Other │ AMERICAN INDIAN/ALASKA NATIVE │        M │                 0.0 │ **0.029 │  -0.007 │               0.0 │
│       Other │                         ASIAN │        F │                 0.0 │   0.023 │   0.001 │              -0.0 │
│       Other │                         ASIAN │        M │               0.001 │   0.009 │   0.011 │               0.0 │
│       Other │        BLACK/AFRICAN AMERICAN │        F │              -0.006 │   0.011 │  -0.036 │             -0.01 │
│       Other │        BLACK/AFRICAN AMERICAN │        M │              -0.001 │   0.014 │  -0.028 │            -0.003 │
│       Other │               HISPANIC/LATINO │        F │              -0.002 │   0.014 │   -0.04 │            -0.004 │
│       Other │               HISPANIC/LATINO │        M │              -0.001 │   0.006 │  -0.025 │            -0.001 │
│       Other │                         WHITE │        F │               0.004 │   0.009 │   0.014 │             0.002 │
│       Other │                         WHITE │        M │               0.006 │  -0.005 │   0.021 │             0.008 │
╰─────────────┴───────────────────────────────┴──────────┴─────────────────────┴─────────┴─────────┴───────────────────╯
Subgroups with Largest Deviations
--------------------
Brier Score (MSE)
----------
- Subgroup: ethnicity=WHITE
- Brier Score (MSE) is 19.3 % higher among this group than the population.

FNR
----------
- Subgroup: insurance=Other,ethnicity=AMERICAN INDIAN/ALASKA NATIVE,gender=M
- FNR is 10.9 % higher among this group than the population.

FPR
----------
- Subgroup: insurance=Medicare,ethnicity=AMERICAN INDIAN/ALASKA NATIVE,gender=F
- FPR is 62.3 % higher among this group than the population.

Positivity Rate
----------
- Subgroup: ethnicity=BLACK/AFRICAN AMERICAN
- Positivity Rate is 28.8 % lower among this group than the population.

saving results to df_fairness.post.csv
Improvements over Baseline Model
If we compare with results from our baseline model in demo_measure_disparity.ipynb, we see that we have made a marked improvement to the maximum subgroup deviations on the test set:
[4]:
from tabulate import tabulate
print(
    tabulate(
        [
        ["Max Subgroup Deviation in Metric (%)","Original","New"],
        ["Brier Score (MSE)",19.9, 19.3],
        ["Subgroup FNR", 20.4, 10.9],
        ["Subgroup FPR",86.0, 62.3],
        ["Positivity Rate",44.9, 28.8],
        ],
        headers="firstrow",
        tablefmt='rounded_outline'
)
     )
╭────────────────────────────────────────┬────────────┬───────╮
│ Max Subgroup Deviation in Metric (%)   │   Original │   New │
├────────────────────────────────────────┼────────────┼───────┤
│ Brier Score (MSE)                      │       19.9 │  19.3 │
│ Subgroup FNR                           │       20.4 │  10.9 │
│ Subgroup FPR                           │       86   │  62.3 │
│ Positivity Rate                        │       44.9 │  28.8 │
╰────────────────────────────────────────┴────────────┴───────╯
In summary, our new model has a more equal false negative rate among groups than before, which was our goal. In addition, we see reductions in the false positive rate deviations and differences in positivity rates.
In terms of overall performance, we see a slight decrease, as we would also expect:
AUROC: 0.881 -> 0.859
AUPRC: 0.77 -> 0.74
By using the model visualization tools above, decision makers can decide whether this model, or another within the set, is a better fit to the use case, as needed.