Measuring Disparities
measure_disparity.py takes as input a pandas Dataframe containing the following observations: - model predictions and probabilities - binary outcomes - demographics
run measure_disparity.py on model output
To run measure_disparity.py on the dataframe, you may use the command line interface, as shown below. It is also possible to import the underlying function like so:
from measure_disparity import measure_disparity
And then call the function. See the API for a full specification of options and requirements.
Below, we demonstrate how to run measure_disparity.py from the command line using a model trained to predict risk of admission to the emergency department using the freely available MIMIC-IV repository.
[1]:
%run ../measure_disparity.py --dataset ../base_model_mimic4_admission.csv
reading in ../base_model_mimic4_admission.csv
demographic columns: ['insurance', 'ethnicity', 'gender']
========================================
Overall Performance
========================================
        Measures of predictive bias on the whole population.
╭─────────┬─────────┬───────────────────┬───────┬───────┬────────────╮
│   AUROC │   AUPRC │   Positivity Rate │   FPR │   FNR │   Accuracy │
├─────────┼─────────┼───────────────────┼───────┼───────┼────────────┤
│   0.881 │    0.77 │             0.299 │  0.08 │ 0.409 │      0.823 │
╰─────────┴─────────┴───────────────────┴───────┴───────┴────────────╯
========================================
Subgroup Fairness Violations
========================================
        Measures the deviation in performance for marginal and intersectional groups.
        Note that these deviation are weighted by group prevalence to produce stable estimates when sample sizes are small.
╭─────────────┬───────────────────────────────┬──────────┬─────────────────────┬─────────┬─────────┬───────────────────╮
│   insurance │                     ethnicity │   gender │   Brier Score (MSE) │     FNR │     FPR │   Positivity Rate │
├─────────────┼───────────────────────────────┼──────────┼─────────────────────┼─────────┼─────────┼───────────────────┤
│         any │                           any │        F │              -0.006 │   0.007 │  -0.015 │            -0.022 │
│         any │                           any │        M │               0.006 │   -0.01 │    0.02 │             0.022 │
│         any │ AMERICAN INDIAN/ALASKA NATIVE │      any │                 0.0 │   0.024 │  -0.036 │              -0.0 │
│         any │                         ASIAN │      any │               0.001 │   0.022 │   0.008 │               0.0 │
│         any │        BLACK/AFRICAN AMERICAN │      any │              -0.012 │   0.015 │  -0.058 │          **-0.035 │
│         any │               HISPANIC/LATINO │      any │              -0.004 │   0.015 │  -0.044 │            -0.012 │
│         any │                         WHITE │      any │             **0.015 │  -0.011 │   0.033 │             0.047 │
│    Medicaid │                           any │      any │              -0.005 │   0.008 │  -0.048 │            -0.013 │
│    Medicaid │ AMERICAN INDIAN/ALASKA NATIVE │        F │                -0.0 │   0.021 │  -0.154 │              -0.0 │
│    Medicaid │ AMERICAN INDIAN/ALASKA NATIVE │        M │                -0.0 │    -0.0 │  -0.034 │              -0.0 │
│    Medicaid │                         ASIAN │        F │                 0.0 │   0.036 │   0.005 │              -0.0 │
│    Medicaid │                         ASIAN │        M │                 0.0 │  -0.004 │   0.056 │               0.0 │
│    Medicaid │        BLACK/AFRICAN AMERICAN │        F │              -0.002 │    0.01 │  -0.085 │            -0.006 │
│    Medicaid │        BLACK/AFRICAN AMERICAN │        M │              -0.001 │   0.009 │  -0.084 │            -0.003 │
│    Medicaid │               HISPANIC/LATINO │        F │              -0.001 │   0.013 │   -0.07 │            -0.003 │
│    Medicaid │               HISPANIC/LATINO │        M │                -0.0 │   0.013 │  -0.027 │            -0.001 │
│    Medicaid │                         WHITE │        F │                -0.0 │   0.007 │  -0.018 │            -0.001 │
│    Medicaid │                         WHITE │        M │                -0.0 │  -0.006 │  -0.006 │              -0.0 │
│    Medicare │                           any │      any │               0.005 │  -0.024 │    0.03 │             0.028 │
│    Medicare │ AMERICAN INDIAN/ALASKA NATIVE │        F │                 0.0 │ **0.047 │ **0.074 │               0.0 │
│    Medicare │ AMERICAN INDIAN/ALASKA NATIVE │        M │                 0.0 │   0.045 │   0.058 │               0.0 │
│    Medicare │                         ASIAN │        F │                 0.0 │   0.019 │   0.007 │               0.0 │
│    Medicare │                         ASIAN │        M │                 0.0 │   -0.03 │   0.046 │               0.0 │
│    Medicare │        BLACK/AFRICAN AMERICAN │        F │              -0.001 │   0.013 │  -0.035 │            -0.003 │
│    Medicare │        BLACK/AFRICAN AMERICAN │        M │                -0.0 │   0.009 │  -0.028 │            -0.002 │
│    Medicare │               HISPANIC/LATINO │        F │                -0.0 │   0.001 │  -0.039 │            -0.001 │
│    Medicare │               HISPANIC/LATINO │        M │                -0.0 │   0.001 │   0.002 │              -0.0 │
│    Medicare │                         WHITE │        F │               0.003 │  -0.026 │   0.041 │             0.015 │
│    Medicare │                         WHITE │        M │               0.003 │  -0.046 │    0.06 │             0.019 │
│       Other │                           any │      any │               0.001 │   0.012 │  -0.007 │            -0.014 │
│       Other │ AMERICAN INDIAN/ALASKA NATIVE │        F │                -0.0 │   0.028 │  -0.076 │              -0.0 │
│       Other │ AMERICAN INDIAN/ALASKA NATIVE │        M │                 0.0 │  -0.001 │  -0.025 │               0.0 │
│       Other │                         ASIAN │        F │                 0.0 │   0.043 │  -0.012 │            -0.001 │
│       Other │                         ASIAN │        M │                 0.0 │   0.002 │   0.023 │             0.001 │
│       Other │        BLACK/AFRICAN AMERICAN │        F │              -0.006 │   0.017 │   -0.07 │            -0.017 │
│       Other │        BLACK/AFRICAN AMERICAN │        M │              -0.001 │   0.021 │  -0.041 │            -0.005 │
│       Other │               HISPANIC/LATINO │        F │              -0.002 │   0.018 │  -0.059 │            -0.006 │
│       Other │               HISPANIC/LATINO │        M │                -0.0 │   0.023 │  -0.017 │            -0.001 │
│       Other │                         WHITE │        F │               0.004 │   0.017 │   0.012 │             0.001 │
│       Other │                         WHITE │        M │               0.005 │  -0.007 │   0.041 │             0.014 │
╰─────────────┴───────────────────────────────┴──────────┴─────────────────────┴─────────┴─────────┴───────────────────╯
Subgroups with Largest Deviations
--------------------
Brier Score (MSE)
----------
- Subgroup: ethnicity=WHITE
- Brier Score (MSE) is 19.9 % higher among this group than the population.

FNR
----------
- Subgroup: insurance=Medicare,ethnicity=AMERICAN INDIAN/ALASKA NATIVE,gender=F
- FNR is 20.4 % higher among this group than the population.

FPR
----------
- Subgroup: insurance=Medicare,ethnicity=AMERICAN INDIAN/ALASKA NATIVE,gender=F
- FPR is 86.0 % higher among this group than the population.

Positivity Rate
----------
- Subgroup: ethnicity=BLACK/AFRICAN AMERICAN
- Positivity Rate is 44.9 % lower among this group than the population.

saving results to df_fairness.csv
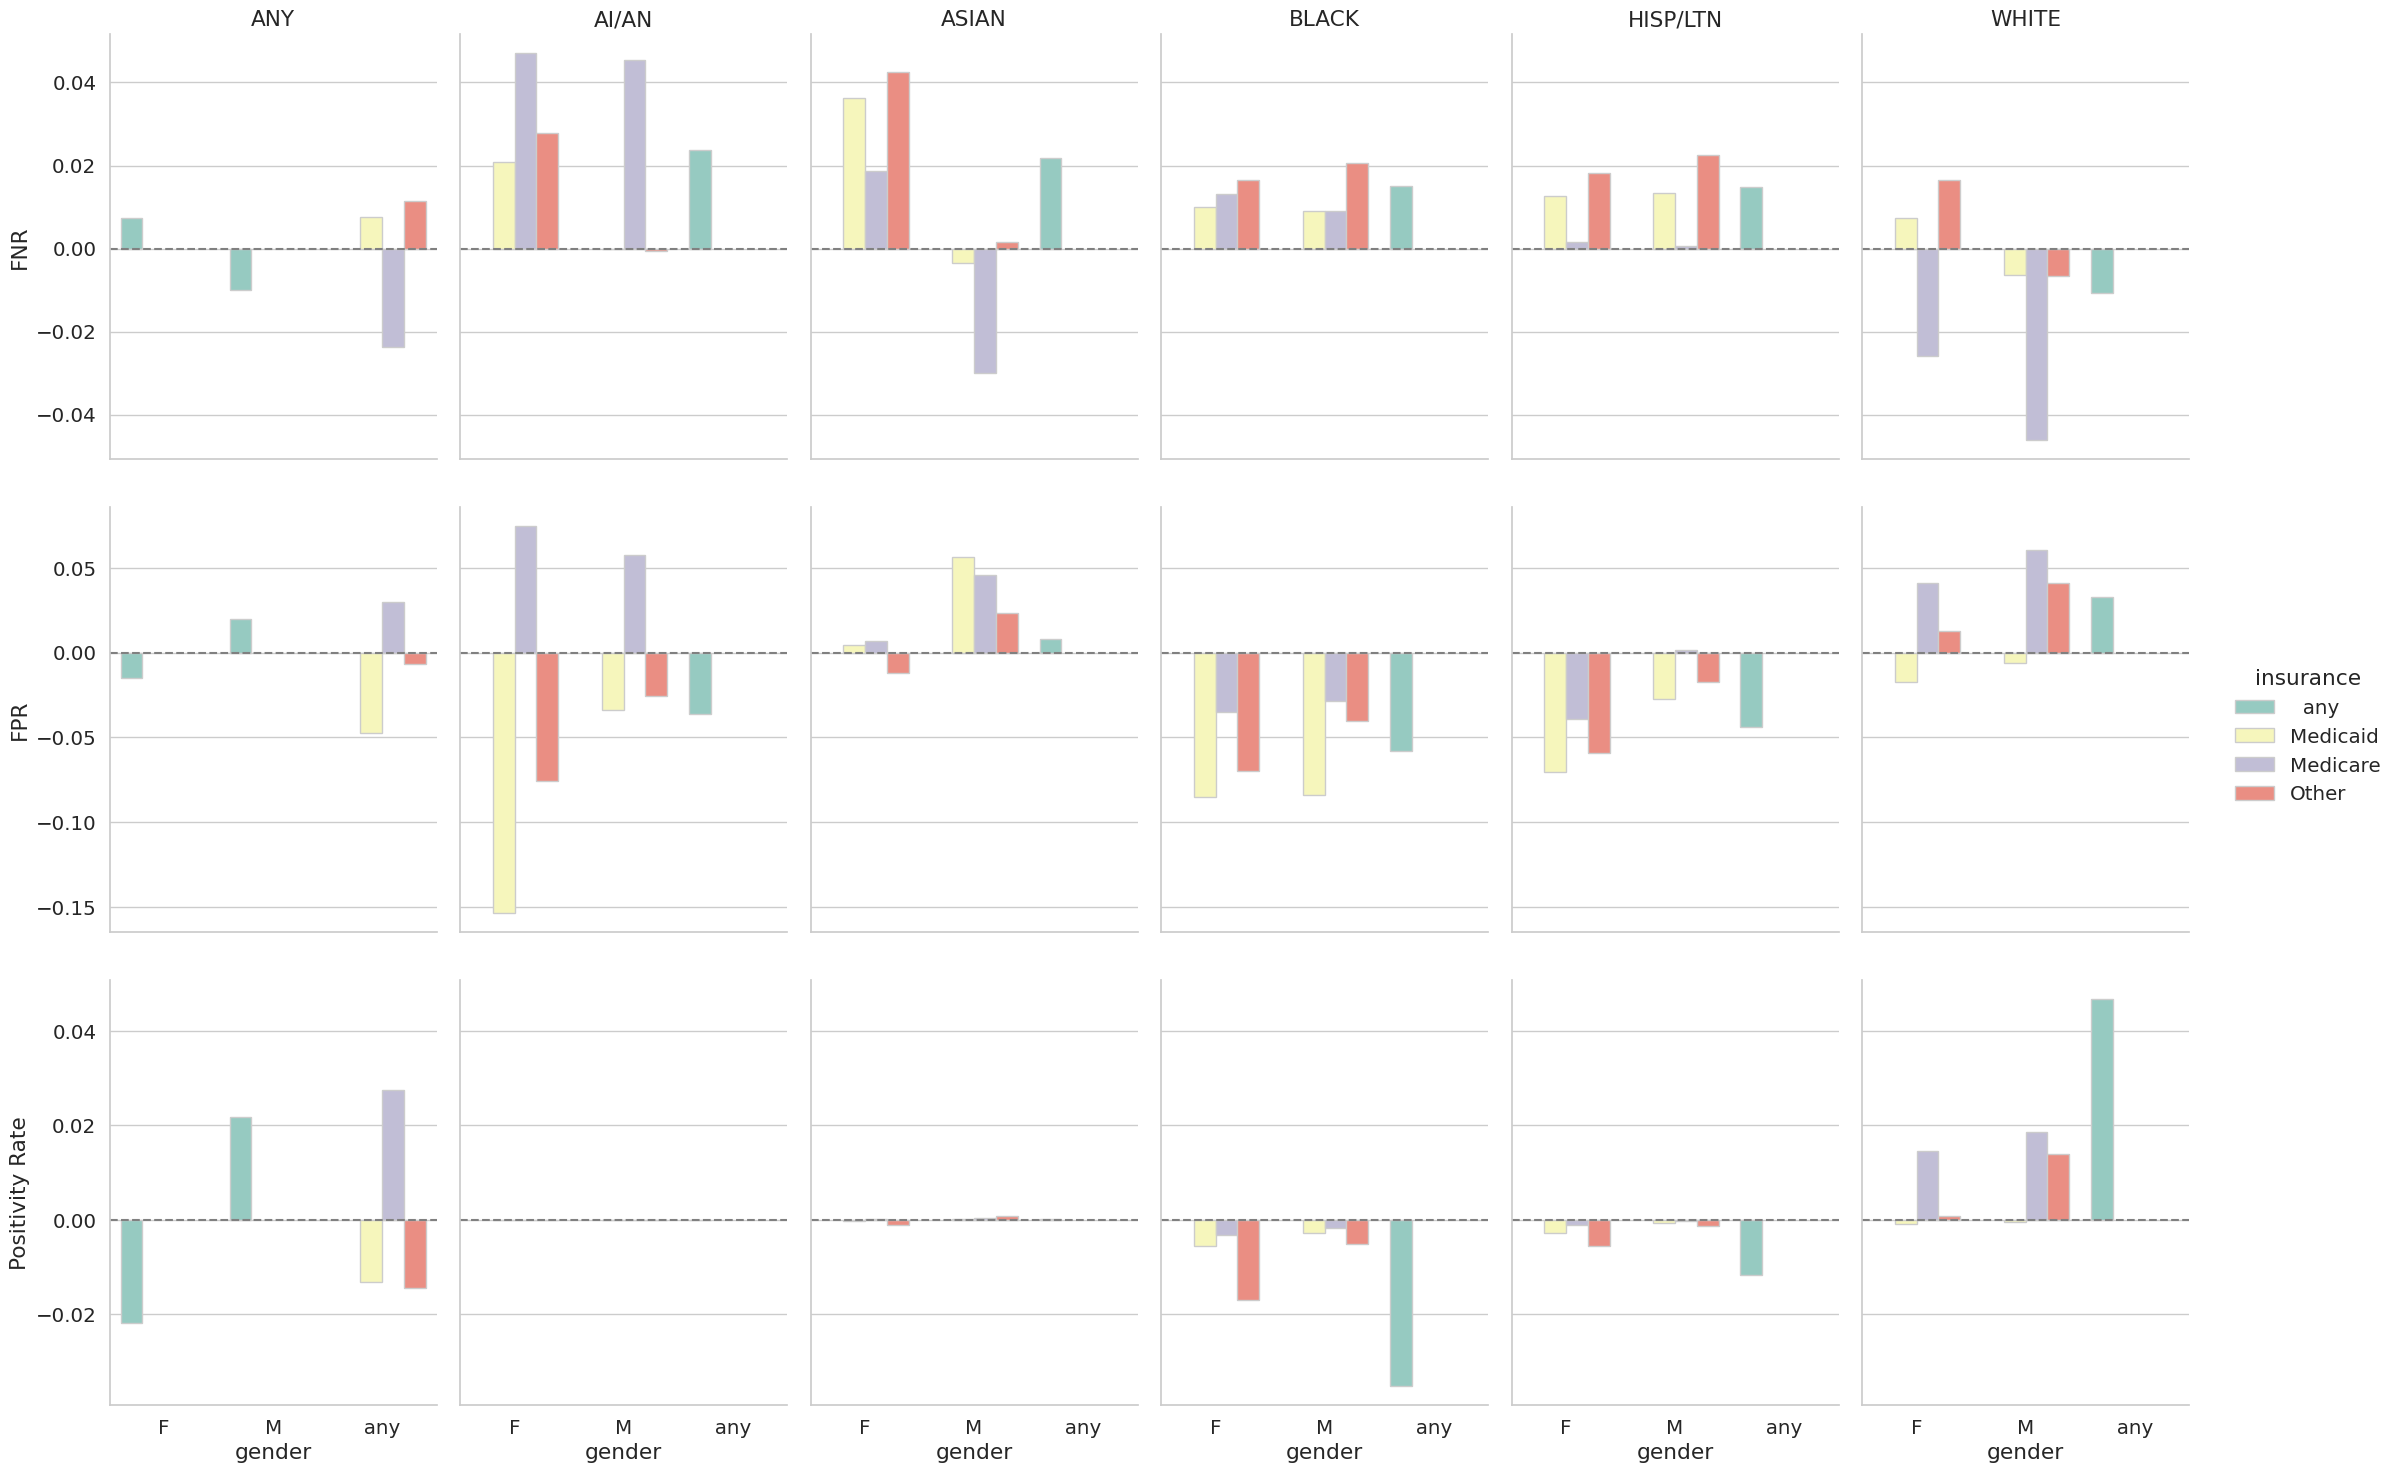
Visualizing results
Running measure_disparity.py produces a df_fairness.csv file containing the resultant fairness metrics. Below, we show how to use this to generate additional figures for assessing model performance and bias.
[2]:
df_fairness = pd.read_csv('df_fairness.csv')
df_plt = (df_fairness
          .melt(
              id_vars = ['insurance','ethnicity','gender']
          )
         )
df_plt = df_plt.loc[~df_plt.variable.str.contains('Brier')]
df_fairness
import seaborn as sns
sns.set_theme(style='whitegrid',font_scale=1.3)

g = sns.catplot(
    kind='bar',
    edgecolor="0.8",
    data=df_plt,
    row='variable',
    col='ethnicity',
    x='gender',
    hue='insurance',
    y='value',
    sharey='row',
    aspect=0.75,
    palette='Set3'
)

g.refline(y=0)

# make titles nicer

nice_cols = {
'AMERICAN INDIAN/ALASKA NATIVE':'AI/AN',
    'BLACK/AFRICAN AMERICAN':'BLACK',
    'HISPANIC/LATINO':'HISP/LTN',
    'WHITE':'WHITE',
    '  any  ':'ANY',
    'ASIAN':'ASIAN'
}
for (row,col),ax in g.axes_dict.items():
    if 'any' in col:
        ax.set_ylabel(row)
    if row == 'FNR':
        ax.set_title(nice_cols[col])
    else:
        ax.set_title('')